
 Surface cover, also known as ground cover and often times just ‘cover’, may be the most VITAL indicator of ecological health. Over half of land management decisions can be made by consistently and objectively tracking surface cover. Because of its extreme importance, we decided to devote this entire newsletter on the topic, discussing some of the key aspects and uses of cover information that might help folks understand the concept better and be able to use it in their grazing and management planning.
A quick definition of surface cover: the amount of material other than bare ground covering the soil – litter, live basal area, moss, and rock. There are a number of ways to consider cover, but the bottom line is simple:
1) What covers the soil?
2) What are the proportions?
Looking Down
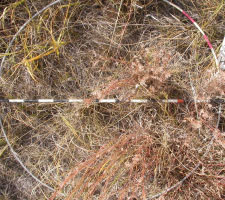
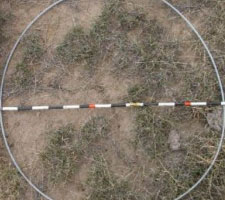
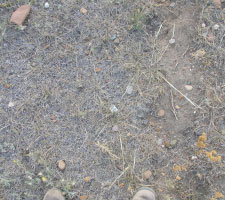
When we ask ranchers if they are monitoring their lands, many of them say Yes. When we ask how they are monitoring, it turns out that most people seem to use the “window survey method” – where they drive across the landscape and look out the window of their pickup. Their land either “looks good” or “looks tough.” Sound familiar? Recognize that looking across a landscape can tell you important information like structure and stubble height, but it can be deceiving when it comes to cover. The only way to get real information about what is happening on your lands is to ‘look down’. Here is an example of a landscape which has surprisingly more bare ground than what a first impression might give.
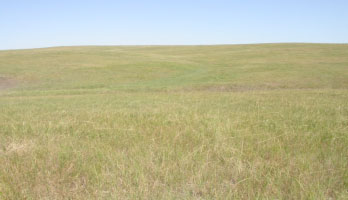
One would think cover is good by gazing across this landscape… one would be wrong…
![]()
This site averaged 65% bare, 25% litter, and 10% basal cover (all rhizomatous plants)
Tracking the few key attributes which cover the soil is extremely important. In fact knowing and understanding aspects about cover provides the key to many management decisions.
The Five Categories of Cover
Land EKG considers 5 categories of cover which when combined add up to 100% of the observation area:
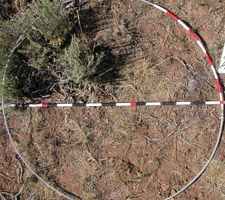
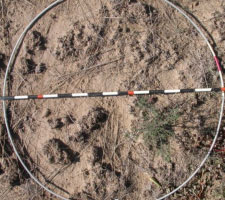
Approx 45% Bare, 27% litter, 28% basal, and litter is contacting soil well
Bare Ground
Just as darkness is actually the absence of light, bare soil is the absence of cover. And bare is our ‘enemy’. Bare mineral soil relates mostly to water cycling -the less bare, the more effective water infiltration, soil/water storage, and higher probability of site stability.
Litter
Any dead organic material lying near or above the ground surface is considered litter. In some cases, litter can be embedded into the ground, such as in the form of dead plant bases. Usually the more the better, however in some cases there is so much litter due to lack of grazing or impact that it affects the production negatively. We consider litter amount and soil contact as primary indicators for the nutrient cycle.
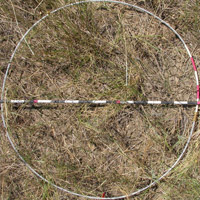
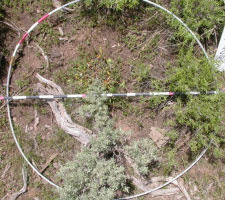
Big and little bluestem, with needle grasses. Though cover is good, basal cover is ~25% in this image
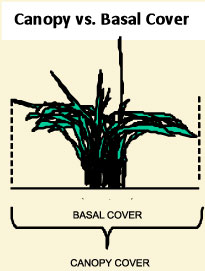
Basal Cover
Defined as the actual percentage of area that the plants take up at ground surface, basal cover represents the biotic state (plants and diversity) and energy flow (production and consumption) in the landscape’s ecological processes ? typically the more the better. Baring extreme weather conditions, plant basal area is more affected by land management than annual or long term precipitation. Thus, if basal cover is decreasing,… pay attention, it is likely not due to a lack of rain.
*see an example of basal cover vs. canopy cover further down*
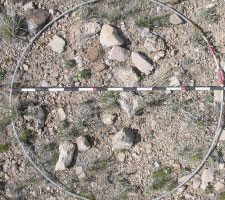
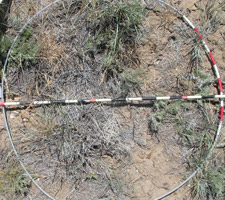
Example of 70% rock cover
Rocks
Rocks can provide a lot of feedback. If you are seeing more, things are degrading and your soil is leaving. If you are seeing less, you are building soil. Rocks can serve an important purpose, for example, in some southwestern and Great Basin parts of the US, a concentrated layer of smaller rocks (.25-.75″ in size) arming the soil surface isn’t uncommon to see. Usually called desert or erosion pavement, it is natures ‘scabbing response’ to avoid soil loss. Though quite stable at that state, it may limit seed germination success.
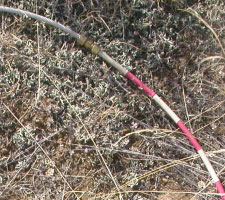
Example of transient lichen
Moss/Lichen
The two major types of moss and lichen we commonly deal with are dense club moss and green transient lichen. Due to its transient nature the lichen appears windblown and dead and easily mistaken for litter, yet it is a live organism which will unfold and attach when wet. Transient lichen when blown by wind has been known to form relatively dense windrows, sometimes poinsoning animals that consume large amounts. Dense clubmoss, is much more persistent, and difficult to address without disturbance.
Creating an Observation Area
Rather than just guessing the surface cover percentages by looking down around your feet, it helps to have a specific observation area with a border for visual estimating. As you can probably tell from the photos, we feel that a 93″e; hoop (which represents 4.8 sq. ft) is the best tool for estimating across diverse landscapes. Furthermore, when these hoops are placed along a transect line and are used in conjunction with annual photography, the estimates become less subjective and more objective.
You Want Me to Estimate What?
Visually estimating cover is always difficult ? period. However, it is a vital for the manager to acknowledge (and write down!) his/her best estimate of proportions of cover. It’s easy to say “lots of bare ground”e; but it is much more beneficial to specifically place a value on what you are seeing in each category. Acknowledging that 80% or 50% or 15% of your land is actually bare, carries much more meaning and weight to the land steward. When you stop and do the math and realizes that only 20%, 10%, or 5% of the land is capturing free sunlight,… this should have a pretty big impact on how you make your management decisions.
All you are doing is filling in your best estimate of the following:
___% Bare,___% Litter, ___% Basal,_ __ %Moss, ___% Rock
It’s easy to be intimidated by the process. We can already hear you saying – How am I supposed to know? Just remember – it’s your best estimate. And hopefully you have consistent photos for reference.
Tricks for Visual Estimations
- Don’t struggle too hard. We spend a lot of time on surface cover reading exercises during our EKG schools. So remember that the more you practice, the more confident you will be. It’s not about being 100% accurate, it’s about making estimates based on what you see. Go with your gut; usually your first impression is the most accurate.
- Human Nature. We tend to overestimate basal cover and underestimate bare ground. Keep this in mind.
- Always think about basic proportions. Is there a lot or a little? Roughly think ‘quarters’ or’ thirds’ proportions: 33%, 50%, 66%, 75%, etc.? Eliminate the small proportions first. Ok, 5% rock, and 10% moss, leaving 85% that is bare, litter, or basal.
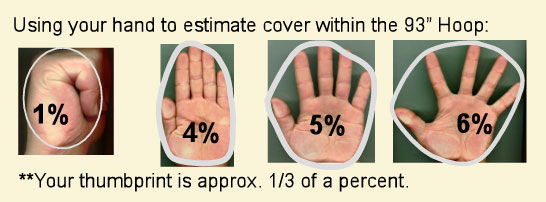
- Use your hands as a tool. On average, most hands will cover about 5% of the hoop, which is a huge help for estimating cover. Use this diagram as a general rule:
- Basal cover is tricky to estimate. As observers we are always looking down through the canopy to estimate basal cover. Remember that basal cover is where the plant goes into the ground – canopy is almost always greater than basal cover. See the diagram for a visual. The size of a plant base has a direct bearing on the amount of plant canopy. The larger the plant bases, the more solar collectors available for herbivores.
Healthy short grass prairie may approach 30-45%. Intermountain areas more commonly will peak out at 35%. Homogeneous plants such as rhizomatous and annual grasses, including smooth brome, western wheatgrass, and cheatgrass will typically have 10% or less basal cover.
Estimating Alongside Repeated Photography is Extremely Powerful.
If done correctly, images can serve as very good hard data collection devices and can be used as a “back-up” for your visual estimates. Repeated photography is an entire newsletter topic by itself, but here are a few basic visuals to get you to understand that in order to get meaningful long-term data to watch change over time, both the photos and the observations need to be done in the exact same spot year after year:
A comparison of the same observation plot from 2007 (left) to 2011 (right).
This area has been in a severe drought. You can see how these photos were taken in the
EXACT same spot in both years and is easy to compare ground cover.
Some Cover Prescriptions
Below are some general “prescriptions”e; that will help you to interpret the surface cover changes you might be seeing over time.
- If basal area is decreasing – shorten the grazing period
- If litter cover is decreasing – reduce the stocking rate
- If bare ground is increasing – change season of use and possibly stock lighter
- If moss is increasing – Increase density of livestock herd.
The high proportion of bare and low fine litter amount would suggest stocking rates have been too high.
An area of heavy dense clubmoss to left, yet very grey and dead looking. The area to the right had been impacted with a shallow chisel plow.
Using Cover to Determine Stocking Rates (when taking half falls short)
As you’ve read in this newsletter, surface cover is a vital ecological indicator. It is so important that we now take it into consideration when determining stocking rates. In the past, the age-old adage “take half, leave half”; – meaning graze 50% of the available forage and leave the other 50% as cover that will hopefully turn into litter – seemed appropriate and even conservative in most situations. However, now we add cover into the equation: if cover is poor and there is 2000 lbs of forage available,…instead of taking 1000 lbs/A and leaving 1000 lbs/A, we well may only take 500 lbs/A (25%). On the other hand, in the same situation if cover is very good, we might consider taking 1500 lbs/A (75%).
Wrap-Up
Our intent in this newsletter was to bring the importance of cover and some of its key factors to your attention – there is so much more to this topic. But hopefully it got your wheels turning, and got you to think about cover on your own place. The bottom line is that cover is vital to track, EKG does it in a straight forward way and consistent way, and this information can be used very effectively for management decisions.
IN OUR NEXT LAND EKG E-NEWSLETTER ISSUE:
Drought Hanging On – A Good Plan Still Helps
If you have any suggestions for future issues, have feedback, or want more information please contact us at:
(307) 366-2445 or contact us by email.