
 Where to Start?
 We know. It can be overwhelming. How do you monitor an entire landscape? What do you look at first? What do you do, Where do you start?
Well, as it turns out – you have to start somewhere. And like most tasks, it helps to start with the basics and get out on the ground and try it out. So, start with these nuts-n-bolts first, then your monitoring efforts can turn into a more structured, accurate, and credible program – but for starters, all you need to do is, well, start.
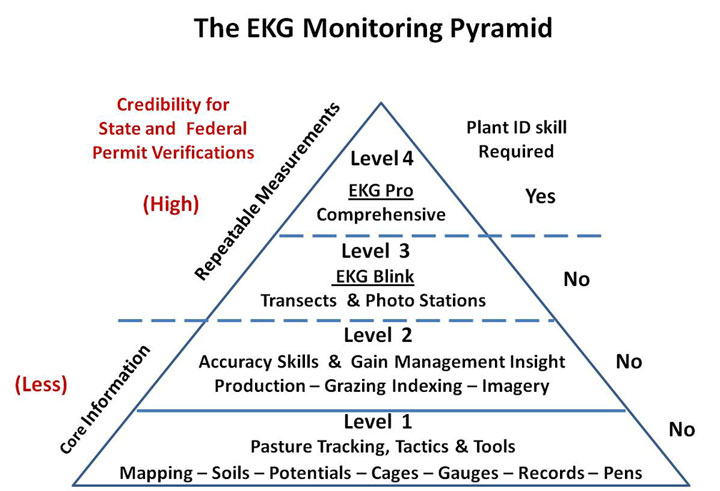
To help people with this concept we came up with the EKG Monitoring Pyramid. And true to the nature of pyramids, the base serves as the key platform to build upon. We call it Level 1. This is where you start, and this is where we will focus our discussion.
An Overview of the EKG Pyramid
Level 1: The first stepping stone. Without understanding and applying these techniques, little effective future monitoring can occur. Introduces mapping, soil surveys and understanding pasture potentials, the importance of record keeping, and brings in key tools and structures necessary to gain valuable pasture information.
Level 2: Increases accuracy of Level 1 information by moving from casual estimates to measurement; forage production/utilization clippings, photography, and scoring grazing management practices (using the grazing records from L1) using the grazing index. Paints a much clearer picture of what is occurring and can yield prescriptions for management.
Level 3: Building on L1 & L2, we now incorporate permanent sites using line Transects and Photo Stations. Simple, repeated facts and images are captured using EKG Blink steps, fully compatible with EKG DataStore. Higher system credibility results and is acceptable for state and public lands documentation and serves as a guide to management direction. Although plant ID is not a requirement, it can be included.
Level 4: Using the sites set in L3, a comprehensive evaluation of nutrient, water, plant community dynamics, and energy flow processes is added to the transect readings. Plant inventory, frequency, and composition are included in this level, requiring plant identification skills. This detailed monitoring can be used as a defense and verification of your management if it is being questioned. This level of monitoring need only be completed once every 5-10 years. In the interim, L3 monitoring can be used annually to maintain the program and give management direction.
Getting Started with Level 1
This foundational level gives land managers a great start to key monitoring practices with limited effort and training, yet sets the stage to expand or improve the process when ready. The categories are practical, intuitive, and rapid, and provide the necessary background information to move up the pyramid. The steps are listed below from the bottom up:
- 6) Record all pasture Grazing records (How many, Date In & Out)
- 5) Set Long term Rain gauges (track moisture year round)
- 4) Set Recovery Pens- help determine if rest periods are adequate
- 3) Set Grazing Cages – Gain production and visual utilization comparisons
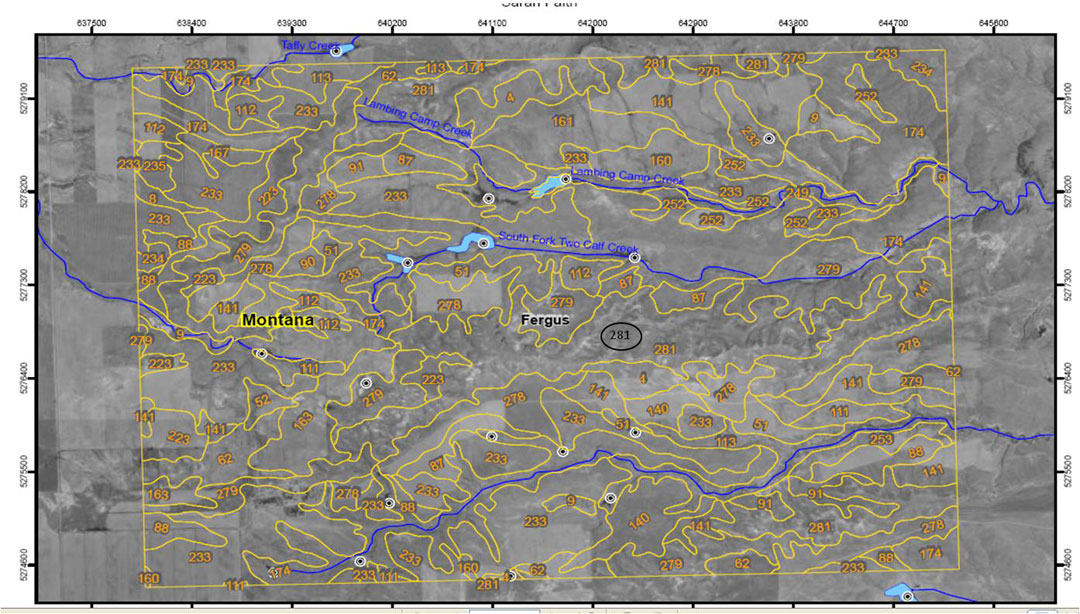
- 2) Soil Survey- Know what plants and production to expect at 3-5 potential areas
- 1) Pasture Map – Determine scale & potential distribution of 3-5 monitoring areas
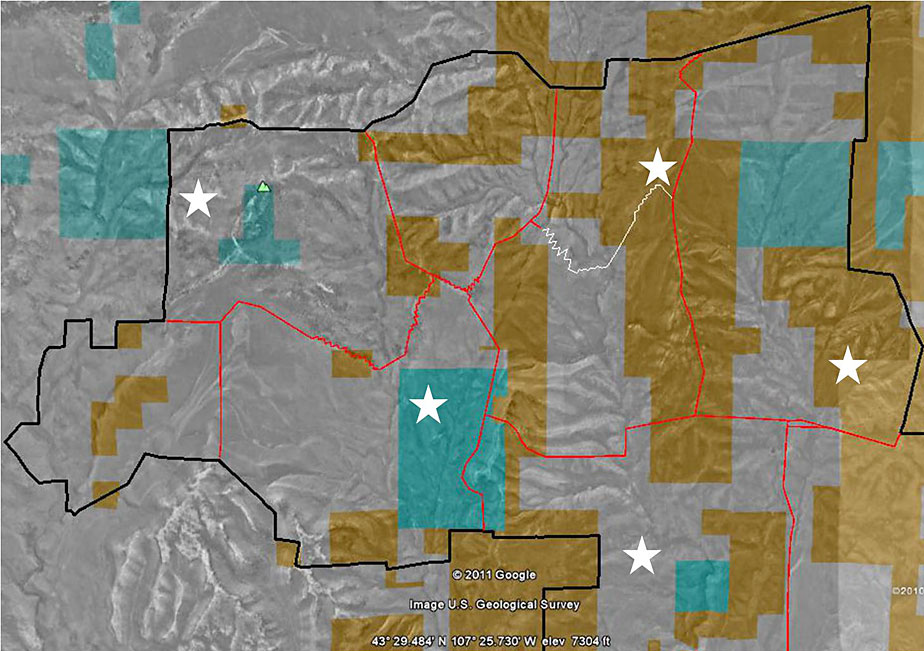
An example of a ranch map using Google Earth with 5 general areas chosen. (click image to enlarge)
Knowing how many areas, where they’ll be, why you chose them, when you’ll look at them, and what to expect is vital.
Without at least a basic Plan, every ‘off the cuff’ let’s git’r done-Willy Nilly -cruise around- throw a cage- kick a turd- snap a picture- call it good monitoring effort ‘ will fail.
Pick 3-5 Areas to Track
The number of ideal monitoring areas is a function of land size, number of pastures, soils, and concern areas – but realistically, set a goal to choose 3-5 areas to track. The total set up time for these areas should about a day. After the set-up year, Level 1 Annual monitoring should take 15 minutes or less per site. That means less than 2 hrs per year – not much.
Ranch Monitoring Map and Soil Survey
To develop a sense of scale of tracking areas on the ranch the most effective tool is a RANCH MAP. Each owner should have a good map. If you don’t yet have a map, there are some excellent (and free) on-line mapping technologies available, our favorite is Google Earth (we host webinar classes on this). Use the map to choose possible tracking area locations that are representative of pastures, general plant communities, or land types.
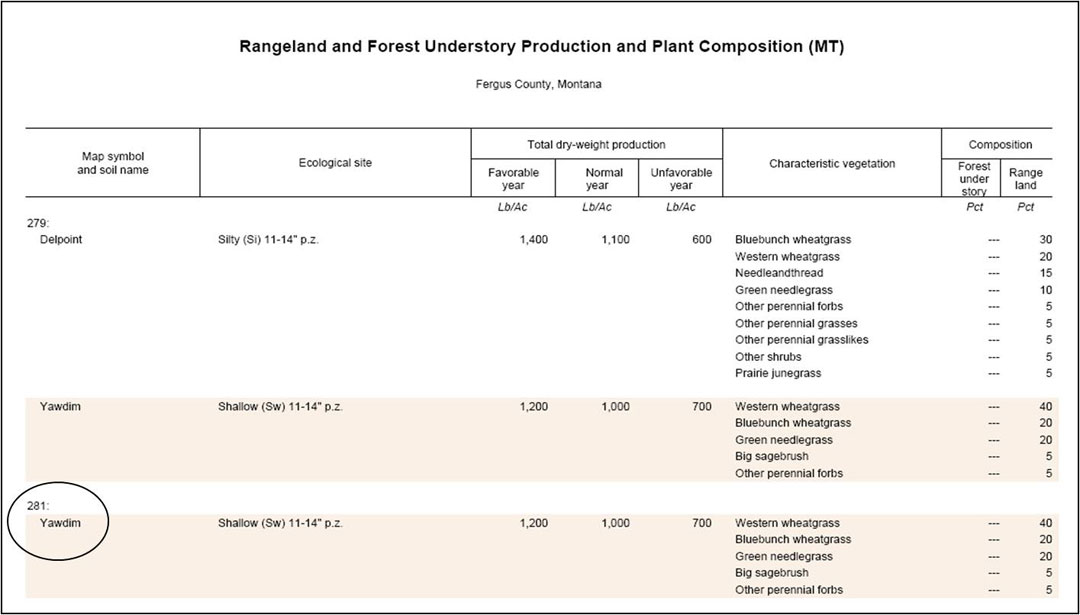
A soils map with corresponding plant community and production information. (click image to enlarge)
If nothing else is done, using the map to plan and soil survey to know what to expect, makes the difference between a Willy Nilly effort, and what can be a useful program.
Ok – Before everyone gets too excited and jumps into the truck to drive out to choose the areas, you need to grab a few materials for setting up your monitoring site structures when you get out there.
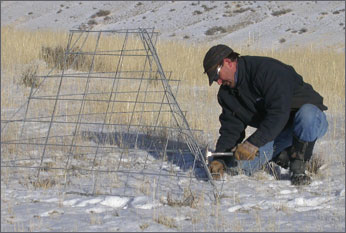
Grazing Cage: One grazing cage will be installed at each pasture tracking area. Grazing Cages allow managers to determine the forage produced for one year (inside cage), and how much remains after grazing at season end (outside cage). The difference between the two is called utilization. Each fall, the cage is moved a short distance to a new representative area that was grazed. We suggest using a cage design which is light, strong and stable, yet easy to move when desired. See this link for suggested design.
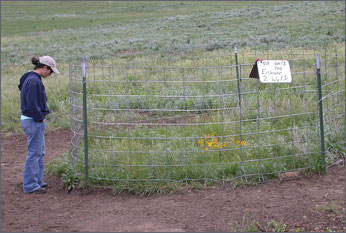
Recovery Pen: Not every tracking area requires a recovery pen, but those that represent major plant or land types should have one. Plan for 1-3 recovery pens for the whole ranch. Recovery pens allow you to view the rangeland response to near term (2-5 yr) rest (see March 2009 Newsletter on Rest & Recovery).
Each Pen requires 4 welded cattle panels 16′ long and 8 steel posts. Realize this is a onetime set up effort, and future evaluations are only possible by reviewing differences inside & outside of these monitoring structures. You’ll be amazed at what you might find.
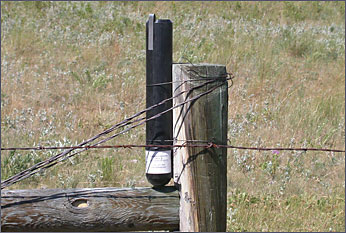
Rain Gauges: Tracking annual precipitation is vital. Choose 2- 4 representative points of moisture distribution and attach long term rain gauges to a fence post near these areas (you can also attach them to a post at a Recovery Pen).

Notebook: As much as we hate to admit it, our memories are not always 100% reliable. Just write it down. Grab yourself a notebook and dedicate it to your monitoring. Our favorites are the 5×7 rite-in-the-rain notebooks. We don’t go anywhere without them. The only thing you have to remember now is where you put that darn notebook?
Ok ? NOW load up the truck with these prepared materials, and hop in.
Choosing Your Pasture Tracking Areas in the Field
Using the ranch and soils map as a guide, find the area you determined on the map and choose a location you consider representative of the pasture (not too close to water). Don’t sweat finding the perfect location at this beginning level, flexibility is built into the system, and no site area is permanent at this point in the program. Go ahead and set up your grazing cage, wire your rain gauge to a post, and install your recovery pen (if using one at this site). Now pull out your notebook.
What to write down at each site on this first visit:
– Date of establishment (late summer or Fall is a good time)
– What plants are expected for area, and production range (Soil Survey tells you this)
– Location -mark on map, take GPS coordinates, and/or write yourself a description
– Grazing records for this pasture – how many head? How long?
– General observations – how does the pasture look? What do you notice?
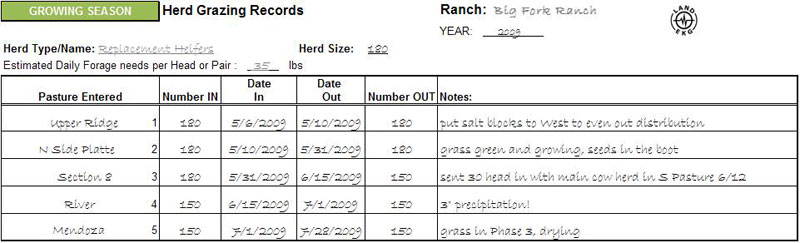
A good example of how to keep track of grazing records
Reading it Next Time
So, now it’s been a whole year since you first set your sites. It’s time to find your notebook and head back out to make the rounds.
What to write down annually:
– Annual grazing records (YOU WILL NEED THESE. Hint: keep records for each stock herd)
– 12 month Precipitation (suggest check/maintain gauges 3x/yr, but AT LEAST once/yr)
– Estimated production inside and outside of cage. Suggest taking a photograph of each (until you know how to accurately measure this)
– Check recovery pens, record any differences seen. Suggest taking a photograph.
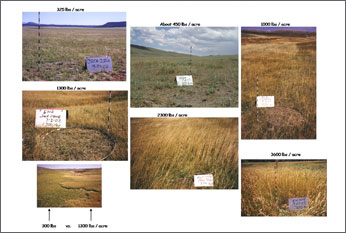
Photo examples for estimating production. (click image to enlarge)
For now, if you do not have a monitoring program started, roll up your sleeves and start with Level 1 of the EKG Monitoring Pyramid. You have to start somewhere, and this is it.
IN OUR NEXT LAND EKG E-NEWSLETTER ISSUE:
Surface Cover – Tracking, Understanding, and Using it for Decisions
If you have any suggestions for future issues, have feedback, or want more information please contact us at:
(307) 366-2445 or contact us by email.